


")


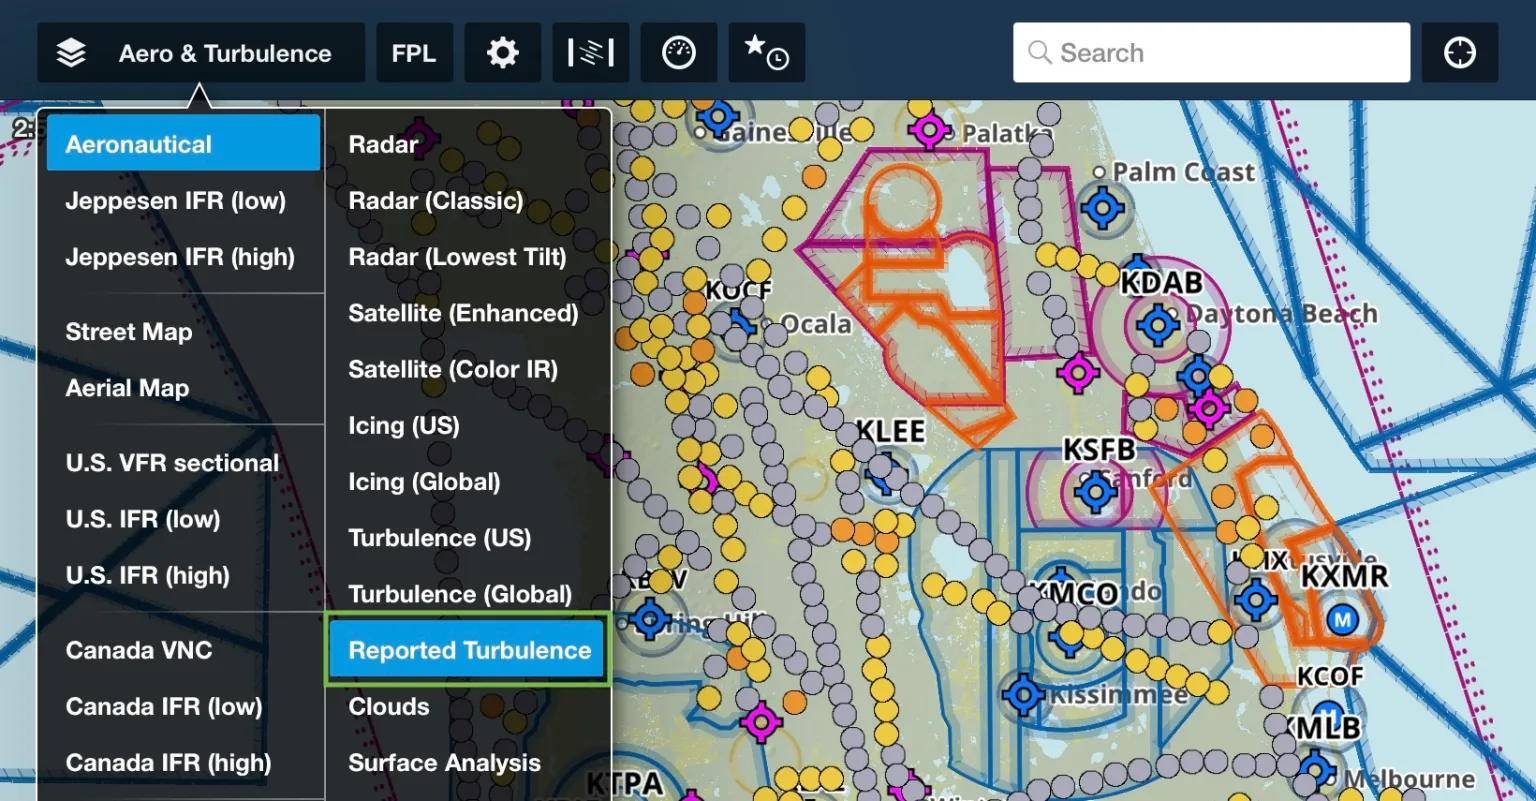
ForeFlight’s latest release features a Reported Turbulence Map—allowing pilots to see where aircraft are encountering turbulence using information sourced from the company’s Sentry ADS-B receivers.
“No one enjoys flying through turbulence, whether you’re piloting a single-engine piston or riding in the back of a jet,” said Henrik Hansen, ForeFlight’s chief technology officer.
ForeFlight says the additional feature within the mobile app displays the measured intensity of turbulence at multiple altitudes, making it easy for pilots to find the smoothest altitude along their flight path. ForeFlight Mobile automatically uploads the reports once it establishes an internet connection after the flight or instantly if connectivity is maintained during flight, according to officials.
Turbulence reports are depicted as colored markers on the Maps tab: Gray signifies smooth air, while yellow, orange and dark orange represent increasing levels of turbulence, ranging from light to severe.
While pilots traditionally rely on weather forecasts and PIREPs for route planning, ForeFlight says its Reported Turbulence method offers distinct advantages, including enhanced accuracy and objective reporting.
ForeFlight estimates its Reported Turbulence layer offers 50 times more turbulence reports than manual PIREPs, per Sporty’s IPAD Pilot News.
Reported Turbulence is available as two add-ons for Pro Plus subscribers. Reported Turbulence (Low) offers access to turbulence reports up to 14,000 feet, whereas Reported Turbulence (All) provides access to reports across all altitudes.

To quote Mel Brooks (As Governor LePetomain) in “Blazing Saddles”–“WHAT WILL IT COST, MAN….WHAT WILL IT COST?”
If you have a Sentry ADS-B the service is free when you register the device on Foreflight. If you have an other manufactures device it is $50 per year. I signed up yesterday.
“Reported Turbulence is available as two add-ons for Pro Plus subscribers.”
That makes it sound like it’s not a free service. Maybe just the submission of the data is free.
What’s the data channel for delivering this content? Separate proprietary data channel or somehow using ADS-B In?
There are limited data pathways to the cockpit.
Where is the turbulence data coming from i.e. which data provider? Is it live data? Thanks!
From the IMUs built into the tablets. Visit the Sporty’s link in the article for more detail.
This is kind of a weird source. Most of my cross countries are 4-5 hour affairs. By the time I land and upload the data, it’s guaranteed to be at least that old for everyone else.
I would like to see Foreflight add new kinds of weather data like Skew-T diagrams that help me estimate cloud tops and freezing levels (for example, it lets me see a temperature inversion that might be an out on a cold day). I’m aware of the icing model in Foreflight that lets me see on a map the potential for ice at various altitudes, but I hear that model is a bit experimental and that I should not rely on it. This turbulence map looks elegant, but Foreflight already lets me cycle through the PIREPs as part of a weather briefing, showing me the location of each PIREP.
Agree! Some marketing genius trying to manufacture synergy among their products that no one wants or asked for.
Exactamente!